
















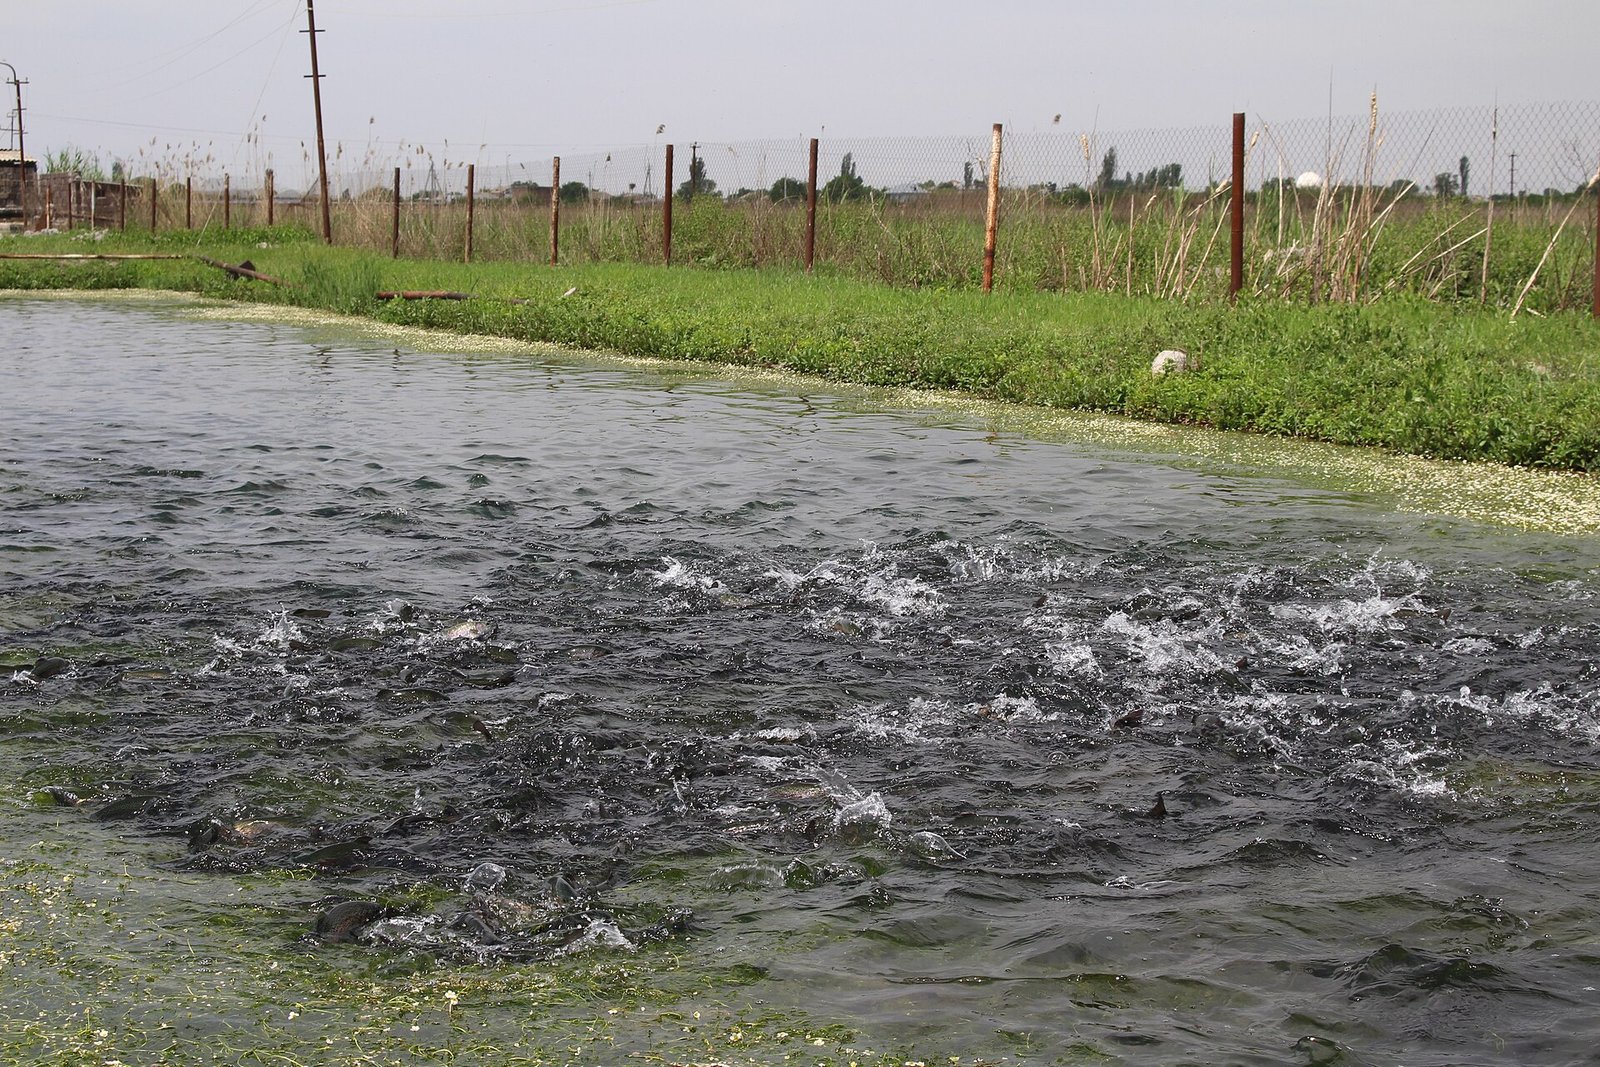
To measure and improve the Feed Conversion Ratio (FCR) in aquaculture, operators divide total feed given by net weight gain, then optimize this metric by maintaining species-specific temperatures (like 24°C–26°C for carp), matching pellet size to mouth gape, using automated precision feeders, and breeding genetically efficient lines. Feed represents the single largest operational cost, accounting for 50 to 60 percent of commercial production budgets. Therefore, achieving a low FCR is a financial necessity to maximize profitability and protect water quality. This guide details the biological and technological mechanisms behind FCR, providing actionable strategies to manage feed efficiency.
Poor feed utilization leads to rapid water quality degradation, creating chronic physiological stress that makes fish susceptible to pathogens. Managing this ratio is therefore the primary mechanism to control disease risk, minimize chemical use, and lower veterinary expenses on the farm. By implementing these data-driven strategies, commercial fish farmers can achieve reliable growth performance and reduce ecological waste.
Key Takeaways
- FCR as the Primary Metric: Calculated as feed given divided by weight gain; lower values indicate higher profitability.
- Waste Scaling: Live FCR of 1.0 captures only 27.8% dry matter, with waste increasing rapidly as FCR degrades.
- Temperature Control: Fish are ectothermic; carp achieve an optimal FCR of 1.18 in a 24°C to 26°C window.
- Pellet Alignment: Feed pellet sizing must match mouth gape across development (0.5 mm to 6.0 mm) to prevent rejection.
- Buoyancy Sizing: Surface feeders require floating extruded pellets, while bottom-dwelling species require sinking formulations.
- Digital Automation: AI models, computer vision, and hydrophones monitor feeding intensity to eliminate feed waste.
- Genomic Selection: Individual daily growth rate is highly heritable (0.75), facilitating breeding for superior feed efficiency.
Table of Contents
- Measuring the Feed Conversion Ratio (FCR) in Commercial Systems
- The Thermodynamic Reality of Dry Matter Recovery and Waste Output
- Downstream Chemistry of Inefficient Feeding: Pond Spoilage Mechanisms
- Biological Controls: Ectothermic Metabolism and Thermal Performance
- Feed Pellet Mechanics: Sizing and Nutrition Across Development
- Precision Feeding Technologies: IoT Sensors, Computer Vision, and Acoustics
- The Genetic Horizon: Breeding for Inherited Feed Conversion Efficiency
Measuring the Feed Conversion Ratio (FCR) in Commercial Systems
Measuring the Feed Conversion Ratio (FCR) requires dividing the total weight of given feed by the net weight gain of the aquatic stock over a specific period. This quantitative index allows commercial operators to evaluate both stock biological efficiency and feed cost-effectiveness. However, commercial systems introduce complex variables requiring precise monitoring.
The Mathematics of FCR and a Reproducible Worked Example
The mathematical formula for calculating the Feed Conversion Ratio is:
FCR = Given Feed / Weight Gain
To understand how this operates in practice, consider a worked example. A commercial operator stocking Labeo rohita starts with an initial biomass of 500 kg in a pond. Over a 30-day feeding cycle, the operator delivers exactly 900 kg of commercial feed pellets. At the end of the cycle, the harvested biomass is measured at 1,100 kg. First, Net Weight Gain = Final Biomass (1,100 kg) - Initial Biomass (500 kg) = 600 kg. Second, FCR = Given Feed (900 kg) / Weight Gain (600 kg) = 1.5. This means for every 1.5 kg of feed supplied, the fish gained 1.0 kg of live body weight, representing the biological FCR.
Crucial Adjustments and Common Mistakes
A common mistake in FCR calculation is failing to account for mortalities. If 10 percent of the stock dies, net biomass gain is underestimated, which artificially inflates FCR. Operators must estimate mortality biomass to calculate the economic FCR, which includes the financial cost of lost feed.
A common misconception is that a lower FCR always maximizes profit. However, a low FCR achieved using extremely expensive high-protein feeds can cost more per kilogram of gain than a slightly higher FCR achieved with cheaper balanced diets. Operators should track feed cost per kilogram of weight gain: Feed Cost = FCR * Feed Unit Price.
Baseline Values Across Species
According to a 2024 guide by Fish Farm Feeder, baseline FCR values vary significantly by species due to anatomical and metabolic differences:
| Species | Baseline Feed Conversion Ratio (FCR) | Rearing Environment |
|---|---|---|
| Sole | 1.1 | Intensive Tanks |
| Salmon | 1.2 | Marine Cages |
| Sea Bass | 1.3 | Recirculating Systems (RAS) |
| Trout | 1.3 | Raceways |
| Carp | 1.5 | Semi-intensive Ponds |
| Tilapia | 1.6 | Intensive Ponds |
| Catfish | 1.8 | Raceways and Ponds |
Lower FCR indicates superior nutrient utilization, which directly enhances operating margins.
The Thermodynamic Reality of Dry Matter Recovery and Waste Output
The thermodynamic reality of feed conversion is that fish dry matter recovery is only 27.8 percent at a 1.0 FCR, meaning the remaining 72.2 percent is released as waste. While FCR is an excellent economic indicator, it is ecologically misleading if operators fail to account for moisture differences. Live fish contain 25 percent dry matter and 75 percent water, whereas commercial feeds contain 90 percent dry matter and 10 percent moisture, creating a thermodynamic imbalance during digestion.
The Water-to-Dry-Matter Relationship
This water-to-dry-matter discrepancy creates a distinct thermodynamic imbalance during feed digestion. At a live FCR of 1.0, 0.9 kg of feed dry matter produces only 0.25 kg of harvested dry biomass, meaning dry matter FCR is 3.6 and recovery is 27.8 percent. The remaining 72.2 percent is lost as dissolved metabolic waste, excreted feces, and uneaten feed.
Quantifying Waste Scaling
As FCR increases, waste production scales up rapidly. A 2005 report by the Global Seafood Alliance details this mathematical relationship:
| Live Feed Conversion Ratio (FCR) | Feed Dry Matter Recovery in Harvested Biomass (%) | Dry Waste Produced (kg per kg of harvested biomass) |
|---|---|---|
| 1.00 | 27.8% | 0.65 kg |
| 1.25 | 22.2% | 0.88 kg |
| 1.50 | 18.5% | 1.10 kg |
| 1.75 | 15.9% | 1.32 kg |
| 2.00 | 13.9% | 1.55 kg |
| 2.25 | 12.3% | 1.78 kg |
| 2.50 | 11.1% | 2.00 kg |
At a typical FCR of 1.5, the feed dry matter recovery rate falls to 18.5 percent. This means that for every 1,000 kilograms of live fish harvested, 1,100 kilograms of dry organic waste is released into the system. If the FCR deteriorates to 2.0, recovery drops to 13.9 percent, and dry waste climbs to 1.55 kilograms per kilogram of fish. Improving feed conversion is therefore the most effective way to minimize waste loading in aquaculture.
Downstream Chemistry of Inefficient Feeding: Pond Spoilage Mechanisms
Inefficient feeding causes organic waste accumulation on the pond bottom, which depletes dissolved oxygen and produces toxic gases like methane and hydrogen sulfide. When FCR rises, the substantial volume of dry organic waste must be processed biochemically by the aquatic ecosystem. Uneaten feed pellets and fish feces accumulate rapidly on the pond bottom, initiating a cascade of negative chemical changes.
Oxygen Depletion and Localized Anoxia
Microbial decomposition of this heavy organic loading consumes significant quantities of dissolved oxygen. This oxygen depletion creates localized anoxia, which is a total lack of oxygen at the soil-water interface. As aerobic bacteria run out of oxygen, anaerobic microbes take over the decomposition process. Anaerobic decomposition at the pond bottom produces toxic gases, specifically methane and hydrogen sulfide.
Hydrogen Sulfide and Physiological Stress
Hydrogen sulfide is highly toxic to aquatic life, even in low concentrations. It damages the gills of fish and restricts their ability to transport oxygen in their blood. The accumulation of these gases creates a highly stressful environment that impairs fish growth, restricts feed appetite, and increases mortality rates.
The chemical degradation of water quality is further compounded by the release of soluble nitrogen and phosphorus from decomposing feed. These minerals act as powerful fertilizers, leading to eutrophication. Eutrophication is the over-enrichment of water bodies with minerals that leads to harmful algal blooms. These massive algal blooms block sunlight from reaching deeper water, and when the algae die, their decomposition further depletes the water's dissolved oxygen.
This biological stress severely impacts fish health. Fish reared in degraded water suffer from chronic physiological stress, making them highly susceptible to bacterial and viral pathogens. Consequently, farms with poor FCR must spend significantly more on water treatment, mechanical aeration, and veterinary interventions. Minimizing waste through precise feed management is therefore essential to prevent disease outbreaks, protect local water resources, and maintain low veterinary costs on the farm.
Biological Controls: Ectothermic Metabolism and Thermal Performance
Water temperature is the primary abiotic factor governing fish ectothermic metabolism, with Labeo rohita achieving an optimal FCR of 1.18 within a 24°C to 26°C window. As ectotherms, fish cannot regulate body temperature, making environmental water temperature the primary driver of metabolism, appetite, and growth.
Ectothermic Physiology and Thermal Windows
Temperatures below the optimal window decline enzyme activity and feed intake, slowing muscle synthesis. Conversely, excessively high temperatures elevate metabolic rates so nutrients are spent on basic maintenance rather than growth, degrading FCR.
The relationship between water temperature and feed efficiency was demonstrated in a 2019 study published in the International Journal of Fisheries and Aquatic Studies. The 12-week feeding trial assessed the FCR of the Indian major carp, Labeo rohita, across six distinct water temperature ranges. Fingerlings were fed a diet with 40 percent crude protein, enriched with Nigella sativa (black cumin) extract at three percent of body weight. The study revealed that water temperature has a major effect on FCR:
- 18°C to 20°C: 2.91 FCR, 93.74% survival
- 20°C to 22°C: 2.08 FCR, 93.16% survival
- 22°C to 24°C: 1.55 FCR, 97.31% survival
- 24°C to 26°C: 1.18 FCR, 100.00% survival
- 26°C to 28°C: 1.25 FCR, 98.48% survival
- 28°C to 30°C: 1.26 FCR, 99.56% survival
Fish reared at 24°C to 26°C showed a 100 percent survival rate and the best FCR (1.18). At 18°C to 20°C, FCR deteriorated to 2.91. The optimal 24°C to 26°C window maximizes feed intake and nutrient assimilation, allocating more energy to muscle synthesis.
Neurological and Immunological Biomarkers
The 2019 study also revealed that water temperature dictates internal physiological health. Brain tissue analysis showed that total brain protein was significantly higher in the optimal 24°C to 26°C range (15.98 g/L compared to 5.70 g/L at 18°C to 20°C). Other critical proteins, specifically brain albumin (7.27 g/L vs 2.55 g/L) and globulin (8.71 g/L vs 3.15 g/L), were also significantly elevated.
These proteins are strongly correlated with a boosted innate immune system. Combining an optimal water temperature of 24°C to 26°C with Nigella sativa extract (Ranunculaceae family)—a potent immunostimulant—maximized both metabolic and immune performance, ensuring the fish remained healthy and efficient at converting feed into body mass.
Feed Pellet Mechanics: Sizing and Nutrition Across Development
Optimizing pellet mechanics requires aligning pellet diameter with fish mouth gape across developmental stages, ranging from 0.5 mm for fry to 6.0 mm for adults. Feed pellet size must align with the fish's mouth gape (maximum mouth opening) across its different life stages. Providing oversized pellets leads to feed rejection, physiological stress, and physical choking hazards.
Physical Pellet Sizing and Feed Intake
Conversely, if pellets are too small, fish expend excessive energy swimming to capture enough feed, which reduces net growth energy. Small pellets also dissolve much faster, causing rapid nutrient leaching of vitamins like C and B-complex. According to a 2025 report by Darin Machinery, feed nutritional profiles and pellet sizes should follow these developmental guidelines:
| Developmental Stage | Recommended Fish Weight (g) | Optimal Pellet Size (mm) | Crude Protein Content (%) | Crude Lipid Content (%) |
|---|---|---|---|---|
| Starter (Fry / Fingerlings) | 0 g - 20 g | 0.5 mm - 1.5 mm | 40% - 50% | 10% - 15% |
| Grower (Juveniles) | 20 g - 100 g | 2.0 mm - 3.0 mm | 30% - 40% | 8% - 12% |
| Finisher (Adults) | >100 g | 4.0 mm - 6.0 mm | 25% - 30% | 5% - 8% |
The physical formatting of the feed must also match the species' natural feeding behavior. Buoyancy formats must align with natural feeding habits—floating pellets for surface feeders like tilapia, and sinking formats for bottom-dwellers like catfish or shrimp.
Extrusion Cooking and Nutrient Profiles
Modern feed processing relies on extrusion cooking to achieve these specific buoyancy properties. Extrusion (high-temperature cooking at 120°C to 160°C) is used to achieve these buoyancy properties. This process improves starch gelatinization and protein digestibility, which lowers FCR. It also creates internal air pockets, allowing feed to float so operators can easily monitor consumption and prevent overfeeding. Using these precise feed types prevents FCR spikes and maintains steady growth performance.
Precision Feeding Technologies: IoT Sensors, Computer Vision, and Acoustics
Precision feeding technologies utilize IoT sensors, AI models, and acoustic hydrophones to monitor fish appetite in real time and automatically halt feed delivery. Precision feeding integrates IoT sensors, automation, and AI models to monitor fish appetite in real time, automatically scheduling feed quantities to systematically lower FCR and eliminate human error.
AI-Driven Feed Scheduling and Predictive Modeling
According to a 2025 review published in Vigyan Varta, integrating AI with real-time sensor data allows operators to optimize feeding schedules. For example, a 2022 study utilized a Gradient Boosting Machine (GBM) model to schedule feeds based on water quality and fish size. This predictive model achieved a 93 percent accuracy rate for predicting FCR and a 72 percent accuracy rate for predicting average daily weight gain (ADG). This allowed operators to adjust feeding times and amounts to match the fish's needs, reducing feed waste.
Computer Vision and Surface Ripple Analysis
Computer vision systems use high-definition cameras and deep learning to analyze surface wave patterns during feeding. For example, an R(2+1)D model achieved 93 percent accuracy in judging appetite in turbid outdoor ponds. In intensive tank systems, a ResNet34 model with an attention mechanism monitored tilapia feeding intensity with 99.7 percent accuracy.
Acoustic Hydrophones and Feeding Intensity Classification
When turbidity limits cameras, operators deploy hydrophones (underwater microphones) to record the crunching sounds of active feeding. A 2020 study showed a clear correlation between feeding sound amplitude and hunger in shrimp. To automate this, a 2023 study used an Audio Spectrum Swin Transformer (ASST) model, achieving 96.16 percent accuracy in classifying feeding intensity.
The system halts feed delivery the moment intensity drops, preventing water degradation. Linking feed data with broader Farm Management Systems (FMS) ensures full operational traceability and optimized predictive forecasting. This system tracks daily feed ingestion alongside environmental variables like dissolved oxygen, pH, and turbidity. When predictive models analyze these data streams together, they can forecast feeding windows with high precision, allowing operators to preemptively adjust feed rates.
Genomic Selection: Breeding for Inherited Feed Conversion Efficiency
Genomic selection improves feed conversion efficiency by using DNA markers to breed fish families with highly heritable growth traits under restricted feeding. While feed management is critical, the biological potential of the fish sets the ultimate limit on feed efficiency. Historically, breeding for superior FCR was challenging because measuring individual feed intake is nearly impossible under group conditions. To overcome this, breeders use genomic selection, which utilizes DNA markers across the genome to predict genetic merit.
Individual Feed Conversion and Genetic Heritability
A 2025 study on European seabass (Dicentrarchus labrax) in France demonstrated this approach. Researchers developed a methodology to estimate individual FCR (iFCR) in separate tanks under controlled juvenile feeding regimes. Individual daily growth rate (iDGC) under restricted feeding was highly heritable (0.75). Since herizability (genetic trait transmission) is so high, iDGC is a reliable predictor of FCR. From 399 genotyped fish, breeders selected parents to establish efficient (Eff+), intermediate (Eff0), and inefficient (Eff-) lines.
Offspring Evaluation and FCR Outcomes
Three years later, the Eff+ offspring achieved a significantly lower group FCR (1.61) compared to the Eff- group (1.83). Efficient offspring were larger (averaging 266 g and 27.4 cm) and leaner than inefficient ones (averaging 223 g and 25.5 cm). Fillet yield was unaffected, proving genomic selection is an effective strategy to lower FCR and accelerate growth.
By identifying specific DNA markers associated with superior feed absorption and lower baseline metabolic demand, genomic selection allows hatchery managers to make highly accurate breeding decisions early in the fish life cycle. In the European seabass trial, these selected lines demonstrated a remarkable 12 percent reduction in group FCR after just a single generation of genetic sorting. This genetic approach bypasses the need for difficult individual feed intake measurements in large communal tanks. By targeting highly heritable traits like daily growth rate under restricted feeding, breeding programs can achieve cumulative, permanent improvements in population FCR over successive generations, enabling operators to secure higher yields from the same feed budget.
Frequently Asked Questions
What is the difference between biological FCR and economic FCR?
Biological FCR measures feed consumed divided by weight gain. Economic FCR accounts for all feed purchased, including uneaten feed and feed lost to mortalities, serving as a financial efficiency metric.
How does water temperature affect the FCR of fish?
Fish are ectotherms and cannot regulate body temperature. A 2019 study on Labeo rohita showed that rearing at an optimal 24°C to 26°C achieved a 1.18 FCR, which deteriorated to 2.91 in cold water (18°C to 20°C) due to depressed metabolic rates.
Why does pellet size matter for feed efficiency?
Pellets must match mouth gape. Oversized pellets cause rejection and choking; undersized pellets lead to excessive energy expenditure during feeding and rapid nutrient leaching in the water column.
What is the role of extrusion cooking in aquaculture feed?
Extrusion uses high heat and pressure (120°C to 160°C) to shape feed, improving starch gelatinization and protein digestibility to lower FCR while creating air pockets that allow pellets to float.
How does genomic selection help improve FCR?
Genomic selection uses DNA markers to breed parents with superior genetic feed efficiency. A 2025 study on European seabass showed that offspring of parents selected for growth rate under restricted feeding achieved a 1.61 FCR versus 1.83 for unselected lines.
What is the dry matter recovery rate of feed?
At an FCR of 1.0, fish recover only 27.8 percent of feed dry matter, with the remaining 72.2 percent lost as waste. At an FCR of 1.5, recovery drops to 18.5 percent, accelerating water degradation.
Conclusion
The single most important takeaway for commercial fish farmers is that the Feed Conversion Ratio is not a static biological variable, but rather a dynamic parameter that can be systematically optimized. To achieve maximum feed efficiency and profitability, operators must transition from traditional manual feeding to an integrated approach that combines biological temperature control, precise pellet size alignment, automated IoT feeding systems, and genetically efficient fish stock. A practical next step for operators is to audit their current feed pellet sizes against standard mouth gape guidelines and establish water temperature monitoring protocols to identify metabolic inefficiencies.
Kaynaklar
- Mishra, B. K., Khalid, M. A., & Labh, S. N. (2019). Assessment of the effect of water temperature on length gain, feed conversion ratio (FCR) and protein profile in brain of Labeo rohita (Hamilton 1822) fed Nigella sativa incorporated diets. International Journal of Fisheries and Aquatic Studies, 7(3), 06-13
- Fish Farm Feeder. (2024). FCR in Aquaculture: Definition, Species Data & Benefits
- Boyd, C. E. (2005). Feed efficiency indicators for responsible aquaculture. Global Seafood Alliance
- Allal, F., Besson, M., Delpuech, E., Barrier-Loiseau, C., Vergnet, A., Morell, F., ... & Vandeputte, M. (2025). Genomic selection for individual feed efficiency in the European seabass: Response to selection on efficiency, commercial traits and sex. Aquaculture, 595, 741682
- Darin Machinery. (2025). How Do Pellet Sizes and Feed Types Affect Fish Growth?
- Chourasia, S., Dubey, S., Mahajan, S. K., Rai, R., Tiwari, P. K., & Rai, S. K. (2025). IoT-Driven Smart Feeding Systems: Advancing Precision Aquaculture. Vigyan Varta, 6(9), 53-58