




















Feed & Nutrition
Feed Rations by Temperature: Building a Seasonal Feeding Curve
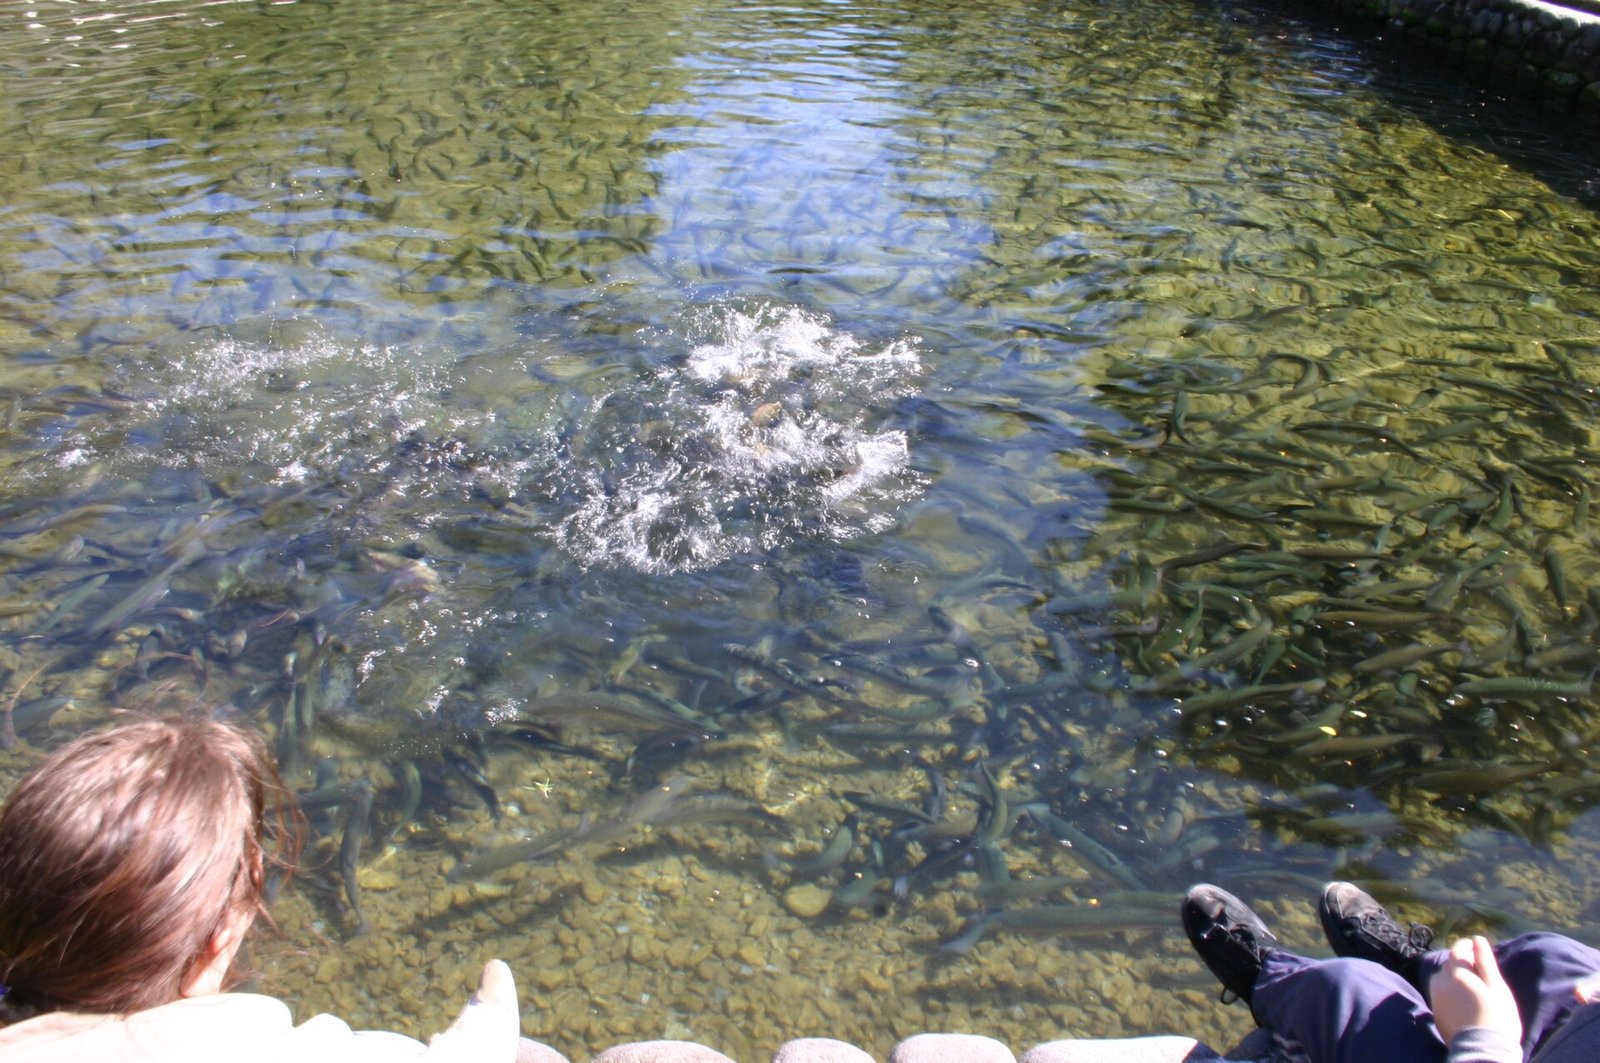
Fish appetite tracks water temperature closely enough within a species' tolerance range that a feeding rate calibrated for 20°C water and left unchanged into a 12°C winter is effectively overfeeding for months, while the same unchanged rate applied through a summer warm spell above the calibration point is effectively underfeeding relative to what the fish could actually use for growth. A fixed daily feeding percentage, set once and applied year-round regardless of season, is one of the most common and most consequential feeding mistakes a farm can make, and it persists mainly because the alternative — a genuinely temperature-responsive feeding curve — takes more active management than checking a single feeding-table percentage once per cycle.
Why temperature drives appetite so directly
Fish are ectothermic, meaning their metabolic rate, and with it their appetite and capacity to digest and process feed, scales directly with ambient water temperature within the species' tolerance range, rising toward an optimal temperature zone and falling off both below and above it. This isn't a minor secondary influence on feeding behaviour the way, say, slight water clarity changes might be — temperature is frequently the single strongest predictor of how much feed a given biomass can actually use productively on a given day, which is exactly why published feeding tables are structured as temperature-by-weight matrices rather than simple weight-only percentage tables.
The cost of overfeeding in cold water
Feeding at a warm-water rate during a cold spell doesn't just waste the uneaten feed cost directly — uneaten or poorly digested feed in cold conditions decomposes and adds nutrient and organic loading to the water at exactly the time of year when biological water-treatment processes (nitrification in particular) often run slower due to the same cold temperature affecting the bacteria responsible for that process, compounding a feed-waste problem into a water-quality problem simultaneously. This double cost, wasted feed plus degraded water quality from that waste, is why cold-season overfeeding tends to cause disproportionate harm relative to the nominal feed-cost waste alone, and it's a pattern that shows up across pond, RAS and flow-through systems alike whenever a feeding rate doesn't adjust downward to match reduced cold-water appetite and digestive capacity.
The cost of underfeeding in warm water
The opposite error, holding a feeding rate calibrated for cooler conditions through a warm period when fish could productively eat and grow more, simply leaves growth on the table that the fish's own metabolism and appetite were ready to support, a less dramatic but still real cost that compounds across however long the mismatch persists. This error is less immediately visible than cold-water overfeeding's water-quality consequences, which is part of why it gets corrected less consistently in practice — a farm notices fouled water or disease pressure from overfeeding more readily than it notices the quieter, harder-to-attribute growth shortfall from underfeeding during a warm period the feeding schedule didn't adjust for.
Building the curve: more than a single seasonal adjustment
A genuine temperature-responsive feeding curve adjusts ration continuously or at frequent intervals as temperature changes through the season, rather than applying a single "summer rate" and a single "winter rate" with an abrupt switch between them at some arbitrary calendar date, since actual water temperature rarely follows a clean seasonal step-function and instead drifts and fluctuates considerably within and across weeks even in a broadly seasonal pattern. Operations with reliable continuous temperature monitoring can build feeding-rate adjustment directly into daily or weekly ration calculations referencing current measured temperature against a feeding-table matrix, rather than estimating based on calendar date or a general sense of "it's gotten colder," which introduces unnecessary imprecision into a variable that's cheap and straightforward to measure directly.
Species-specific optimal temperature zones
Every species has its own specific optimal temperature range where appetite and growth peak, and the feeding curve needs to be built around that species-specific zone rather than a generic warm-equals-more, cold-equals-less assumption that doesn't account for species differing meaningfully in both their optimal zone's location and the steepness of appetite fall-off above and below it. A cold-tolerant species like Arctic charr, discussed elsewhere in this series, shows a different, lower optimal temperature zone than a tropical species like tilapia, meaning a feeding curve built for one species' temperature response can't simply be relabeled and applied to a different species sharing the same water body or region without checking the target species' own specific temperature-appetite relationship first.
Transition periods: where mistakes concentrate
The spring warming and autumn cooling transition periods, when temperature is actively changing rather than holding at a seasonal extreme, are where feeding-rate mismatches most commonly accumulate in practice, since these periods demand the most frequent feeding-rate reassessment exactly when farm staff attention may be focused on other seasonal transition tasks (grading, stocking, harvest planning) competing for the same limited attention. Building a specific, deliberate practice of more frequent feeding-rate review during these transition windows, rather than assuming the previous season's rate remains approximately correct until an obvious problem forces a reassessment, catches the kind of gradual drift between actual appetite and applied ration that a less disciplined review schedule tends to miss until real growth or water-quality cost has already accumulated.
Putting this into a practical feeding plan
Build your feeding plan around the fish feeding table guide's temperature-and-weight matrix framework, calculate actual daily feed requirement against current measured temperature and sampled biomass using the fish feed requirement calculator, and track whether realised growth is actually tracking the curve's implicit growth assumption using the SGR growth calculator, adjusting the curve itself if real growth consistently diverges from what the temperature-based feeding rate assumed it would produce.
Combining temperature with other appetite-affecting factors
Temperature is the dominant driver of appetite, but it isn't the only one, and a well-built feeding curve needs to account for how other factors modify the temperature-based baseline rather than treating temperature as the sole input to a feeding-rate decision. Recent handling or grading events, ongoing health treatments, and dissolved oxygen levels running below optimal can all suppress appetite below what temperature alone would predict, meaning a feeding rate calculated purely from a temperature-and-weight matrix without checking these secondary factors can still overfeed a population that's eating less than its temperature-predicted baseline for an unrelated reason. Checking actual feeding response (observed consumption at a check tray or feeding station, where practical) against the temperature-predicted ration, rather than trusting the calculated number blindly, catches this kind of secondary suppression before it produces the same water-quality and waste consequences as a pure temperature-mismatch overfeeding error.
Regional and site-specific curve calibration
A published, generic temperature-feeding curve for a given species provides a reasonable starting framework, but actual optimal feeding rates at a specific site can diverge from generic published figures based on local water chemistry, strain-specific growth characteristics, and feed-formulation differences between what a generic curve assumed and what a specific farm actually uses. Farms with several seasons of their own growth and feed-conversion data should progressively calibrate their feeding curve against that accumulated site-specific experience rather than relying indefinitely on a generic published starting point, since the generic curve is a reasonable first approximation but rarely remains the most accurate model for a specific site once enough of that site's own data has accumulated to refine it.
Monitoring tools that make this practical at scale
Continuous temperature logging, now inexpensive and widely available, removes the practical excuse for estimating temperature from memory or infrequent spot checks when building and maintaining a responsive feeding curve, and pairing that continuous temperature data with a systematic feeding-rate adjustment protocol (whether a simple lookup table checked weekly or a more automated calculation tied directly to logged data) turns this from a theoretically important but practically neglected consideration into an actual routine operating practice. Operations without this kind of systematic temperature-to-feeding-rate linkage in place are, in effect, choosing to accept the overfeeding and underfeeding costs discussed throughout this piece as an ongoing, avoidable cost of operating without a cheap monitoring investment that would address it directly.
Why this matters more at larger production scale
Exactly as with pellet-size transition timing discussed elsewhere in this series, the absolute cost of a feeding-curve mismatch scales directly with total feed volume, meaning a farm running a larger total biomass has proportionally more at stake in getting temperature-responsive feeding right than the topic's relatively modest profile in typical production discussions might suggest. A seemingly small percentage-point feeding-rate error, compounded across months of mismatch and a large total feed volume, represents a meaningful absolute cost that a disciplined, temperature-responsive feeding curve addresses at a monitoring cost that's genuinely small relative to the waste and water-quality risk it prevents.
Frequently asked questions
Why does water temperature matter more than almost any other feeding variable?
Fish are ectothermic, so their metabolic rate, appetite and digestive capacity scale directly with ambient water temperature within their tolerance range. This makes temperature frequently the single strongest predictor of how much feed a given biomass can actually use productively on a given day.
What's the specific risk of overfeeding during a cold spell?
Beyond the direct cost of wasted feed, uneaten or poorly digested feed in cold water decomposes and adds organic and nutrient loading at exactly the time biological water treatment processes like nitrification often run slower due to the same cold temperature, compounding a feed-waste problem into a water-quality problem.
Is underfeeding during warm weather as noticeable as overfeeding in cold weather?
No, which is part of why it persists longer in practice. Cold-water overfeeding produces visible water-quality consequences that prompt correction; warm-weather underfeeding simply leaves growth on the table more quietly, without an obvious proximate cause forcing a review.
Should feeding rate change on a fixed calendar schedule?
No. Actual water temperature rarely follows a clean seasonal step-function, drifting and fluctuating within and across weeks even in a broadly seasonal pattern. A feeding curve referencing current measured temperature directly is more precise than adjusting rate based on calendar date alone.
When are feeding-rate mismatches most likely to occur?
During spring warming and autumn cooling transition periods, when temperature is actively changing and farm attention may be focused on other seasonal tasks competing for the same limited review time, making deliberate, more frequent feeding-rate reassessment during these windows especially valuable.
Should a feeding curve ever rely purely on temperature alone?
No. Recent handling, health treatments and low dissolved oxygen can all suppress appetite below what temperature alone predicts. Checking actual feeding response against the temperature-calculated ration, rather than trusting the number blindly, catches this kind of secondary suppression before it produces the same waste and water-quality consequences as a pure temperature mismatch.
Key takeaways
- Water temperature is frequently the single strongest predictor of fish appetite and feeding capacity, making a flat, unchanging feeding rate one of the most consequential common feeding mistakes.
- Cold-water overfeeding compounds a feed-waste cost with a water-quality cost, since uneaten feed decomposes while biological treatment processes often run slower in cold conditions.
- Warm-weather underfeeding is a quieter, less visible cost that leaves growth on the table without an obvious proximate cause forcing correction.
- A genuine feeding curve adjusts continuously against measured temperature rather than switching between a few fixed seasonal rates on a calendar schedule.
- Spring and autumn transition periods are where feeding-rate mismatches most commonly accumulate, warranting deliberately more frequent review during those windows specifically.